
Just for the record..
Posted : October 25, 2004 at 1:37 pm [America/Los_Angeles]
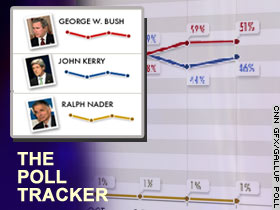
Gallup announced its latest poll results. Notice that the numbers for President Bush has actually gone down from the previous week. It was 52-44 in favor of President Bush last week. It’s now a 5 point deficit. And that too amongst the “likely” voters. Amongst the “registered” voters, it is statistically a dead heat with a 2 point difference in favor of President Bush. I am not even going to worry about the internals of the folks who were polled and how reflective they are of the 130 million that’s estimated to vote in this Presidential Elections.
Update (10/25/2004 15:18 PDT) :
Read this article to understand why Gallup’s latest poll numbers continue to skew the results in favor of Republicans. Why? As the article demonstrates, these poll numbers are based on an assumption that more Republicans will show on the day of elections than Democrats, a fact that was not true both in 1996 and 2000 Presidential elections. And with all the News outlets reporting more number of “newly” registered Democrats than Republicans, I don’t see why these numbers will not hold true going forward.
I guess we will find out if Gallup’s numbers are accurate in 7 days or so.
However, just for the record, here’s the poll numbers from Gallup (starting from Oct. 1st right up to the day of the Election) from the last Presidential Elections (2000):
| Gallup/CNN/USA Today Poll |
|||||||
| Date | Gore/Lieberman (D) % | Bush/Cheney (R) % | Buchanan/Foster (Reform) % | Nader/LaDuke (Green) % | Not Sure % | ||
|---|---|---|---|---|---|---|---|
| 11/5-6/00 # @ | 46 | 48 | 1 | 4 | - | ||
| 11/5-6/00 # | 45 | 47 | 1 | 4 | 3 | ||
| 11/4-5/00 # | 45 | 47 | 1 | 4 | 3 | ||
| 11/2-4/00 # | 43 | 48 | 1 | 4 | 4 | ||
| 11/1-3/00 # | 43 | 47 | - | 5 | 5 | ||
| 10/31-11/2/00 # | 42 | 48 | - | 5 | 5 | ||
| 10/30-11/1/00 # | 43 | 47 | 1 | 4 | 5 | ||
| 10/29-31/00 # | 43 | 48 | 1 | 3 | 5 | ||
| 10/28-30/00 # | 44 | 47 | 1 | 3 | 5 | ||
| 10/27-29/00 # | 44 | 47 | 1 | 2 | 6 | ||
| 10/26-28/00 # | 42 | 49 | 1 | 3 | 5 | ||
| 10/25-27/00 # | 42 | 49 | 1 | 3 | 5 | ||
| 10/24-26/00 # | 39 | 52 | 1 | 4 | 4 | ||
| 10/23-25/00 # | 42 | 49 | 1 | 3 | 5 | ||
| 10/22-24/00 # | 43 | 48 | 1 | 3 | 5 | ||
| 10/21-23/00 # | 46 | 45 | 1 | 3 | 5 | ||
| 10/20-22/00 # | 44 | 46 | 1 | 4 | 5 | ||
| 10/19-21/00 # | 41 | 50 | 1 | 3 | 5 | ||
| 10/18-20/00 # | 40 | 51 | 1 | 4 | 4 | ||
| 10/17-19/00 # | 40 | 50 | - | 4 | 6 | ||
| 10/16-18/00 # | 39 | 49 | - | 5 | 7 | ||
| 10/15-17/00 # | 42 | 48 | - | 4 | 6 | ||
| 10/14-16/00 # | 44 | 47 | - | 3 | 6 | ||
| 10/13-15/00 # | 44 | 47 | 1 | 3 | 5 | ||
| 10/12-14/00 # | 43 | 48 | 1 | 2 | 6 | ||
| 10/11-13/00 # | 44 | 48 | 1 | 2 | 5 | ||
| 10/10-12/00 # | 45 | 45 | 0 | 3 | 7 | ||
| 10/9-11/00 # | 45 | 44 | 1 | 2 | 8 | ||
| 10/8-10/00 # | 45 | 45 | 1 | 2 | 7 | ||
| 10/7-9/00 # | 44 | 47 | 1 | 3 | 5 | ||
| 10/6-8/00 # | 42 | 50 | - | 4 | 4 | ||
| 10/5-7/00 # | 41 | 49 | 1 | 4 | 5 | ||
| 10/4-6/00 # | 41 | 48 | 1 | 4 | 6 | ||
| 10/3-5/00 # | 45 | 44 | 1 | 4 | 6 | ||
| 10/2-4/00 # | 51 | 40 | 1 | 2 | 6 | ||
| 10/1-3/00 # | 49 | 41 | 1 | 2 | 7 | ||
| 9/30-10/2/00 # | 46 | 44 | 1 | 2 | 7 | ||
Source: Polling Report
A quick perusal through the numbers shows that there were some outrageous numbers favoring Bush/Cheney ticket (52-39) less than two weeks before the election. We all know what the actual end result - Gore/Leiberman ticket won the popular vote by around 500,000 votes!
I don’t know if it’s going to happen again or not. What I do know is this: When a poll of 1000 voters shows that the result is within the MOE, then voters should not assume anything! There is a reason why we have a margin of error. Needless to say, taking the results from polling 1000 voters and extrapolating it to 130 million voters is bound to have a MOE!
- Anand
Category: United (or not) State of American Politics 2004